August 9-14 2021 (XR02)
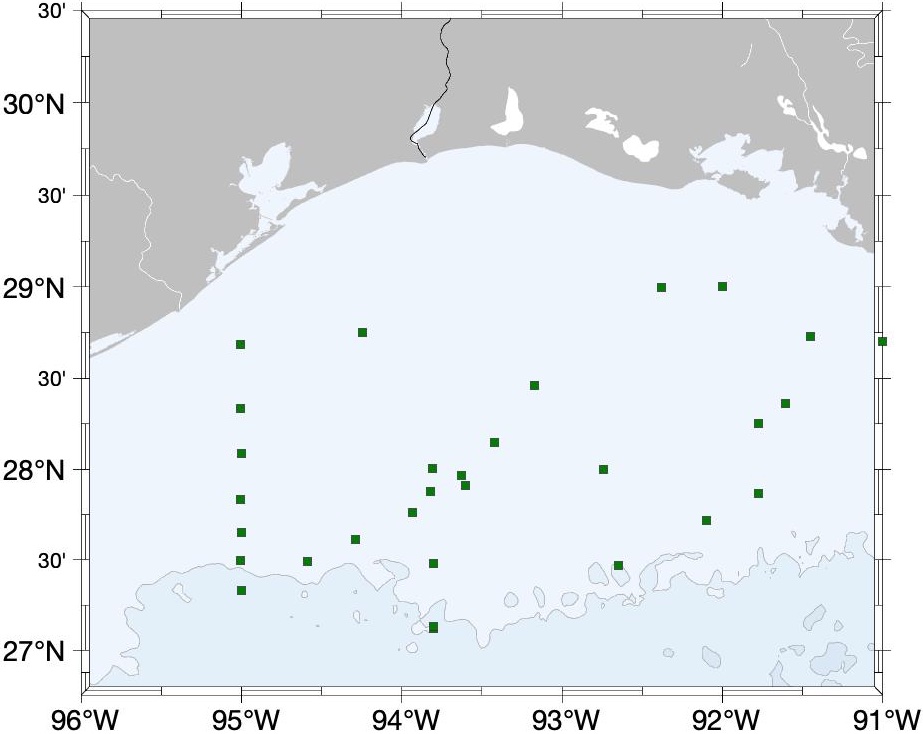
1. Station map
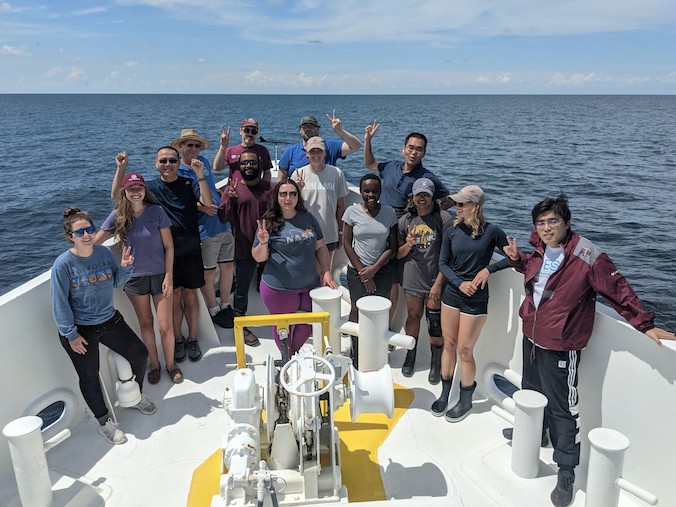
2. Cruise Participants
Chief Scientist
Dr. Steven F. DiMarco (TAMU/GERG)
Senior Scientists
Dr. Xinping Hu (TAMUCC), project lead
Dr. Piers Chapman (TAMU), Oxygen chemistry, nutrients
Dr. Kerri Whilden (TAMU/GERG), Wave Gilder
Scientific Party
Reshmi Joseph (TAMU/GERG), CTD samplingSamantha Longridge (TAMU/OCNG), CTD sampling
Dr. Sakib Mahmud (TAMU/OCNG), served as additional marine tech
Dr. Xiao Ge (TAMU/OCNG), CTD sampling
Nicole Kumbula (TAMUCC), DIC sampling, CTD sampling
Cory Staryk (TAMUCC), DIC sampling, CTD sampling
Merrill, Kenzie,(TAMUCC), Microplastic sampling
Molly Brzezinski (TAMUCC), Microbial sampling
Dr. Hang Yin (TAMUCC), DIC sampling, CTD sampling
3. Sample Collection
During the cruise, CTD casts were made at 33 stations across the studied area. A total of 234 dissolved oxygen samples were analyzed on board the ship using Winkler titration. A total of 255 nutrient samples and 120 salinity samples were collected for lab analysis at GERG/TAMU. A total of 173 samples were collected for carbonate chemistry characterization (total alkalinity, total dissolved inorganic carbon, and pH) at TAMU-CC. A subset of the carbonate chemistry samples were analyzed for pH using spectrophotometric method on board the ship. In addition, a number of samples were collected for oil, methanol, and microbial analyses for the collaborators of the scientific party on board.
4. Wave glider deployment
On August 13, a wave glider was depolyed near the Flower Garden Banks National Marine Sactuary and started collecting data on surface salinity, temeprature, wave height, pH, and pCO2.
5. Preliminary Results
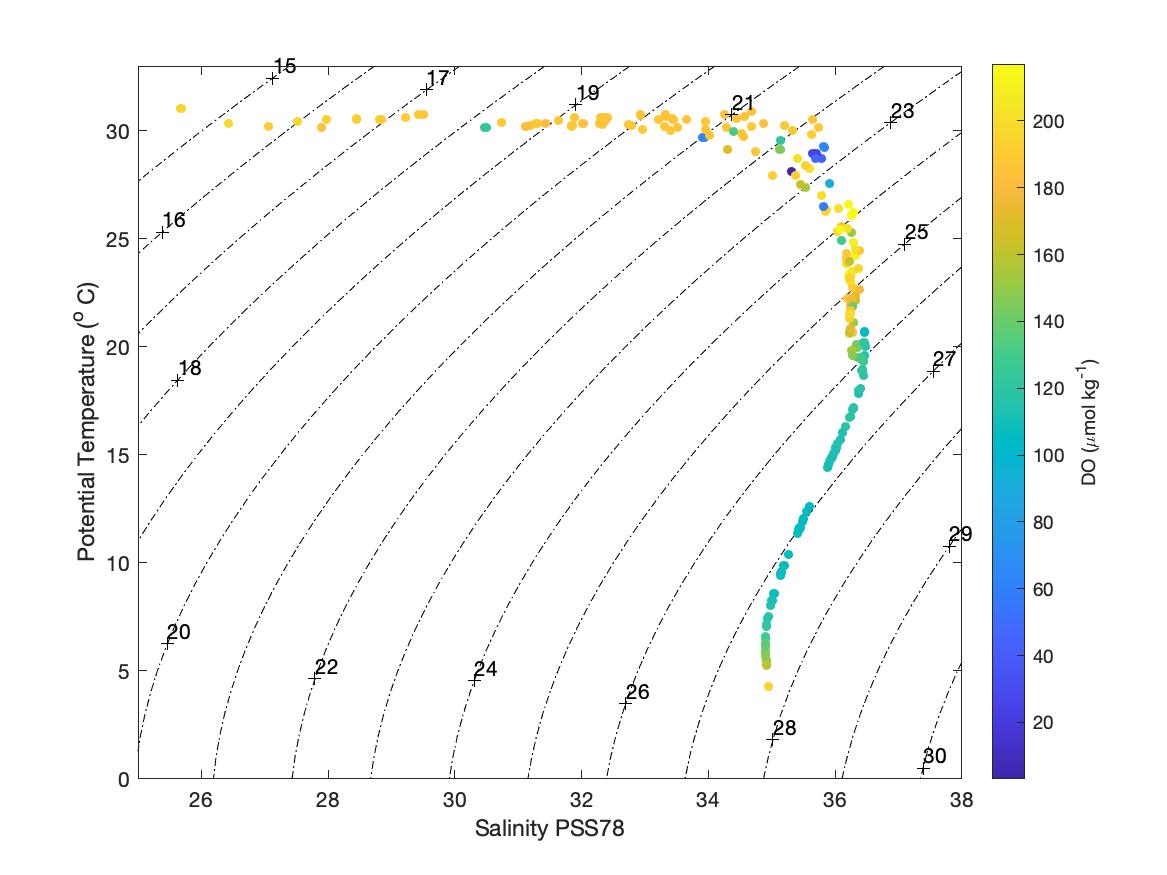
Fig. 2 A scatter plot of potential temperature and salinity from all CTD cases.
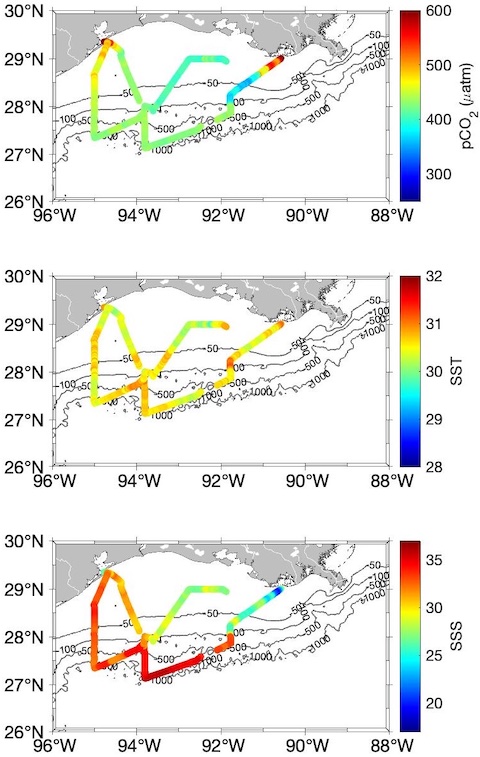
Fig. 3 Sea surface CO2 partial pressure (pCO2), temperature (SST), and salinity (SSS) along the cruise track.