Ocean and Coastal Acidification Monitoring
EPA Cooperative Agreement Numbers:
CE-98685812-0
EPA Q-TRAK#: 16-249
Coastal Bend Bays & Estuaries Program Contract No. 1605

V. Results and Discussion
VI. Conclusions
VII. References
From November 9 2016 to August 23 2017, we monitored hourly water CO2 partial pressure (pCO2) and pH (on total scale) using SunburstS? SAMICO2 and SAtlanticS? SeaFET pH sensors, respectively, at ~1 m depth in the Aransas Ship Channel, Texas. The objective was to examine the estuarine acidification issue as a result of freshwater inflow from the rivers. Unfortunately, a post Hurricane Harvey accident destroyed the research pier of University of Texas Marine Science Institute, where the two sensors were located. Therefore, the monitoring work had to be cut short. Nevertheless, during the approximately 10-month monitoring period, significant seasonal variations of both pCO2 and pH were observed with a range of xx-xx Áatm and xx-xx, respectively. Higher pCO2 and lower pH were observed during xx-xx period and low pCO2 and high pH were observed during xx-xx period. Diurnal changes of both pCO2 and pH were larger during xx-xx period but showed smaller range during the summer. Salinity and temperature both exert controls on the variation of pCO2 and pH at different extents, indicating sensitivity of the estuarine water carbonate system to changes in both hydrological condition and temperature. Carbonate alkalinity was calculated based on pCO2 and pH data was the highest in xx and lowest in xx, and showed an inverse relationship with salinity. Carbonate saturation state with respect to aragonite (the mineral for larval stage oysters) was consistently above xx, indicating optimal condition at least in the Aransas Ship Channel waters.
We would like to thank the Ocean and Coastal Acidification program at the U.S. Environmental Protection Agency and the Coastal Bend Bays and Estuaries Program for supporting this project. University of Texas Marine Science Institute (UTMSI) graciously provided the deployment platform on their research pier for us to carry out the monitoring work. Bill Adams at UTMSI helped with designing and mounting the monitoring structure on the research pier. Mission-Aransas Estuarine Research Reserve (MANERR) provided their monitoring data (salinity and temperature) for cross validation with ours.
Ocean acidification (OA), widely known as caused by the invasion of atmospheric CO2 into the surface ocean, has become a global concern as OA leads to decreases in both carbonate saturation state and pH (an increase in proton level) in surface ocean {Doney 2009 #1311}{Feely 2004 #338}. Seawater carbonate chemistry changes have been shown to affect the calcifying organisms by depressing their calcification rates {Kleypas, 1999 #504}, an effect not only leading to the reduced production of the calcifying organisms themselves {Langdon 2000 #18}{Waldbusser 2014 #3339}, but a deterioration of habitats that these organisms maintain, such as oyster reefs and coral reefs {Shaw 2012 #2376}{Andersson 2015 #3843}.
Relative to the studies in effect of OA on open and tropical oceans, coastal ocean acidification studies started recently and multiple processes that lead to CO2 buildup in seawater have been attributed to the acidification including not only atmospheric CO2 intrusion, but CO2 from respiration within the water column due to settling of nutrient-enhanced surface primary production {Cai 2011 #2173}{Wallace 2014 #3169}. Due to uptake of atmospheric CO2 in coastal waters, it is expected that acidified coastal ocean could further acidify the estuaries, the continuum between the river and the ocean. However, current studies have mostly focused on theoretical explorations of this
A recent study published in the journal
To further study the acidification phenomenon in estuarine settings in south Texas, especially under the current ocean acidification conditions (due to the uptake of atmospheric CO2 by the open ocean), which could add to the already acidifying estuarine water, this project examines high temporal changes in both pH and partial pressure of CO2 (pCO2) using two in situ sensors (a SAtlanticS? SeaFET pH sensor and a SunburstS? Submersible Autonomous Moored Instrument for CO2, or SAMI-CO2) that are capable of taking hourly measurements for extended period of time (projected to be years). The sensors were deployed at the research pier of UTMSI (27?50'17"N, 97?3'1"W).
This work complements ongoing field data collection (biweekly to monthly) at five System-Wide Monitoring Program (SWMP) sites located within the Mission Aransas Estuary Research Reserve (MANERR), where a suite of water carbonate chemistry (pH using spectrophotometric method, total dissolved inorganic carbon, and total titration alkalinity) and auxiliary data (dissolved oxygen, chlorophyll, and salinity) are being collected. The high temporal resolution data from the sensors allowed us to examine both the short-term (daily to monthly) variations and long-term (interannual) changes in water carbonate system in the Port Aransas Ship Channel, which connects estuarine water with that in the northwestern Gulf of Mexico coast, under the influence of freshwater inflow variation and ocean acidification effect.
This project generated a high temporal resolution (hourly) pH and pCO2 dataset. The data file contains the following columns of data:
- A date/time stamp (local standard time)
- Parameter value columns;
- A parameter flag column (the parameter header is preceded by a F_) after each parameter column indicating collected (C) or interpolated (I) data;
Parameters reported
- pH: pH on total scale at in situ condition;
- pCO2: pCO2 at in situ condition in microatmopshere (µatm);
- Auxiliary data - Temp: water temperature measured in degrees Celsius (oC);
- Auxiliary data - Sal: salinity measured in parts per thousand (ppt);
IV.1. Research Pier at University of Texas Marine Science Institute (UTMSI)
The research pier of UTMSI (27o50'17"N, 97o3'1"W) allows direct access to in situ seawater in the Aransas Pass tidal inlet connecting the Gulf with the Aransas, Corpus Christi, and Redfish Bays. This 300 ft. pier has a 1200 sq. ft. lab at its base and a 150 sq. ft. instrument room on the end. The terminus of the pier and instrument room houses a weather station, tide gauge, current meter, and sensors for water temperature and salinity. Gauges and sensors are all located at ~5 m underwater. The MANERR maintains the salinity and temperature sensors, and data are being recorded every 15 minutes.
IV.2. Sampling Process Design
This monitoring effort were carried out at one of the five MANERR’s System-Wide Monitoring Program (SWMP) locations - on the lower deck of the UTMSI’s research pier inside the Port Aransas Ship Channel. This project was designed to collect pH and pCO2 data using two separate in situ sensors and incorporate temperature and salinity data collected by a YSI data logger maintained by MANERR for a period of at least one year from the start of the deployment. The pH data were collected using a Satlantic ® SeaFET pH sensor (on total pH scale) and pCO2 were collected using a Sunburst ® SAMI-CO2. The pH and pCO2 sensors also collected temperature as temperature is used in the internal computations of these two instruments. Data collected by the sensors were saved in the onboard data loggers for periodical download during our biweekly or monthly MANERR survey. Salinity and temperature data from the YSI data logger were downloaded from the CDMO website (http://cdmo.baruch.sc.edu/get/export.cfm). Due to increased costs for the telemetry service and contractor, it is not clear how long the data were available real-time. The MANERR has applied for funding to purchase GOES satellite transmitters to switch the telemetry method for the water quality data. Regardless of the status of the real-time data availability, the data can be obtained from MANERR staff or from the CDMO website. The MANERR staff manually download data at least monthly and performs primary and secondary QA/QC on the data and uploads the data to the CDMO quarterly.
Both sensors worked continuously for a 10-month period and their deployment was disrupted by Hurrican Harvey. IV.3. Sampling methods
Automated Sampling Procedures
Prior to deployment, internal clocks of both sensors were set to universal time (UST) and synchronized with the YSI data logger’s clock. The auxiliary data from the YSI, including both salinity and temperature, were taken from the in situ data logger located at 1 m above the sea bed at ~5 m water depth. The YSI data logger collects readings every 15 minutes. For practical purposes (battery life), we set data collection frequency for the pH and pCO2 data to once per hour.
In situ pH and pCO2 data were collected using two separate sensors based on electronic data collection. The deployment location for the sensors is at the lower deck of UTMSI’s research pier. Ideally both sensors should be deployed in the water. However, to reduce the cost of maintenance mostly related to biofouling (for example sending down divers every two weeks in warmer months or every one month during winter), the sensors were measuring both pH and pCO2 from an ex situ position but using continuous in situ seawater pumped from ~1 m below the sea surface (see design and actual depolyment in Fig. 1), where a YSI 660X2 salinity/temerapture sonde was located. Briefly, a side flow pipe was connected to the main pipe that led to a FloJet pump to obtain an at least 5.0 L/min flow rate. This water flow was directed to a coller that measures approximately 1 x 0.5 x 0.5 m3 where the two sensors were submerged and mounted securely on the bottom. Provided with sufficient water flow, we expected that the water temperature change to be minimal between the water inlet and within the cooler. Prior to data collection at each time point, a minimum of 20 min of flushing of the waterbox was needed.
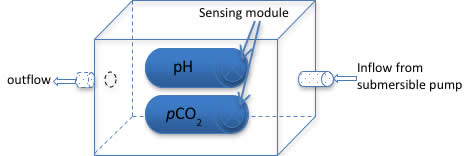
Fig. 1. A schematic design of the waterbox used for housing the pH and pCO2 sensors on the lower deck of UTMSI's research pier.
Sensor Maintenance
Both sensors were serviced regularly by CCL field technicians. Each time the sensors were taken out of the waterbox, cleaned for biofouling, then replace anti-fouling guards and put back into the box. MANERR staff maintained the YSI data logger for temperature and salinity and provide data quality assurance/quality control (QA/QC). See section B9 for details.
Water Sampling
Duplicate water samples at both the pump inlet depth using a Van Dorn sampling bottle and inside the cooler through siphoning were taken right before sensor removal/cleaning and after replacing them back into the water box. Water temperature and salinity were collected using a MANERR handheld YSI data sonde at the pump inlet depth and inside the waterbox. Water sample collection followed standard protocol for ocean carbonate chemistry studies (Dickson et al. 2007). 250 ml ground glass borosilicate bottle was be used and overflow of at least one bottle volume is needed. After sample collection, 100 µL saturated mercury chloride (HgCl2) was injected into the sampling bottle to arrest biological activity, and Apiezon ® grease was applied to the bottle stopper, which was then secured to the bottle using a rubber band and a nylon hose clamp. See Appendix D for the Standard Operating Procedures (SOP).